How to display rows of a report using a section rule
Use report definition rules to select and present data in a wide variety of formats that allow user interaction with the displayed results. The default format presents rows and columns, with each value having a fixed width. Some reports using the default format may be very wide or contain a lot of white space.
As an alternative to the default presentation, you can configure section rules to display rows in a report. This allows you to arrange values vertically, apply colors, fonts, decorations and other style elements to improve the usability and appearance of the report display.
For more information on report definition rules, see PDN articles Reporting in V6.2 - Nine tutorial videos and Report Definition rules - Beyond the basics.
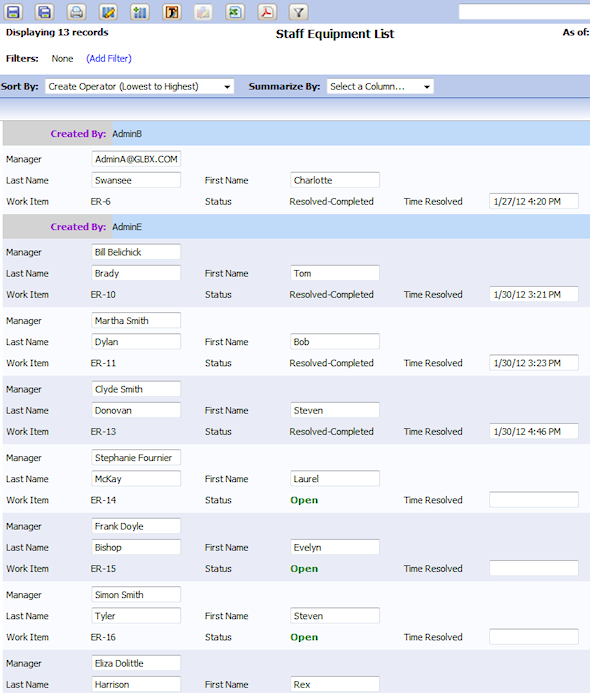
In the example below, a manager generates a report that displays a list of employees for whom equipment is requested. The report includes the employee, the employee's manager, and work item status information. In the steps below, you create a report definition rule that includes the appropriate database columns, then preview the contents of the report as it displays in rows. Next, you create section rules in which to display the report content. You reference the section rules in the report definition rule, then preview the contents of your report as it appears using custom sections.
Suggested Approach
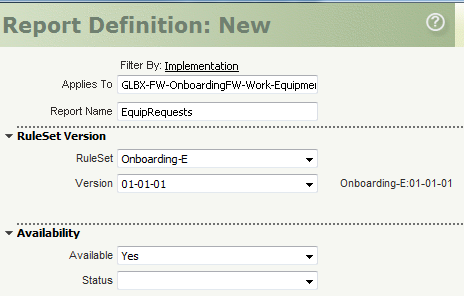
Step 1: Create a report definition rule. This rule identifies the database columns and rows to include in your report, along with format and sorting options, custom sections, and more.
- Enter the appropriate class in the Applies To field, and enter a name for this report definition rule.
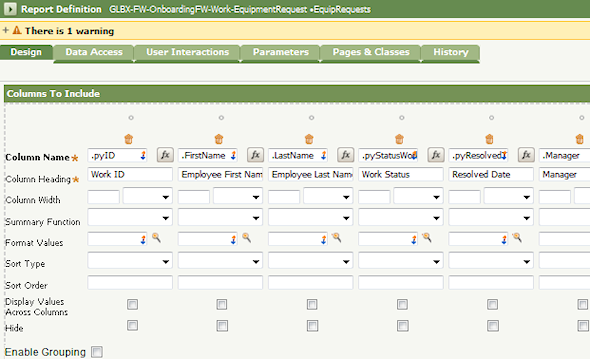
- On the Design tab, enter the columns you would like to include in your report. Choose a Single Value property identified by a property reference. You can also select or create a calculation.
Only properties that have been exposed as database columns are available. See How to expose a property as a database column with the Property Optimization tool for more information.
The column headings are populated with text from the property Description field. You can override this value with your own heading text.
The columns appear in the report in the same order they appear in this tab, unless you override the layout by using a custom section, as explained in Step 3.
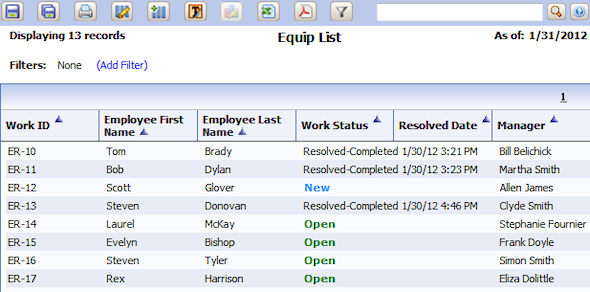
- Click Save & Preview to view the report.
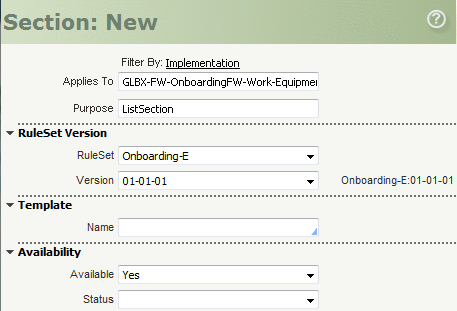
Step 2: Create a section that is to define the layout and appearance of the report rows. Set the Applies To class of the section to be the same class as the report definition rule.
- Create the section.
- Create the layout and include the properties that you would like to show in the report. Be sure to test carefully.
You can enter labels that differ from those you entered in the report definition rule.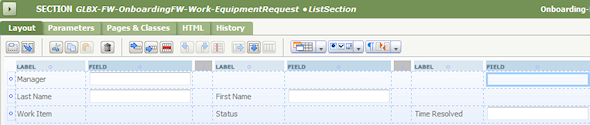
- Save the section rule.
Step 3: Reference the custom section for displaying rows in your report definition rule.
- In the report definition rule General Report Settings section (on the Design tab), check the Use custom section for displaying rows checkbox.
- Use the SmartPrompt to select the section you created in the previous step.
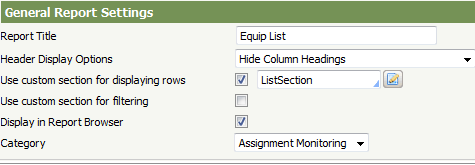
- In the Header Display Options field, select
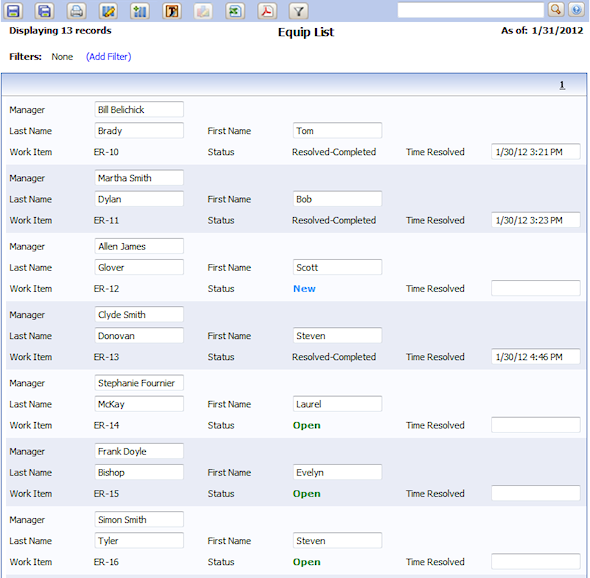
Hide Column Headingsto prevent the display of headings you defined in the Columns to Include section. You can create custom headings, as explained in Step 4. - Click Save & Preview to view the report. The example below uses the ListSection section to display the rows of data.
Step 4: Optionally, create another section to group data and change the appearance of the header row. In this example, group the data in the report by the Operator ID, pxCreateOperator, that created the work items. Further, change the style of the header row to have colors and right justification. In Step 5, add this information to the report definition rule.
- Create the section for your header row data. The section must be part of the same class as the report definition rule in which it is used.
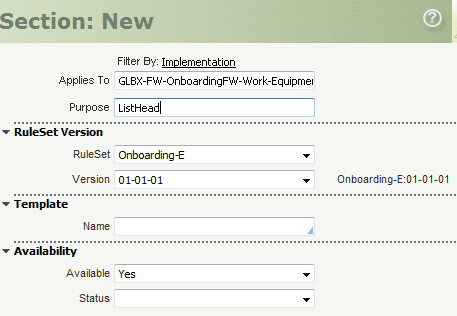
- Include the properties and labels as you would like them to appear in the report.
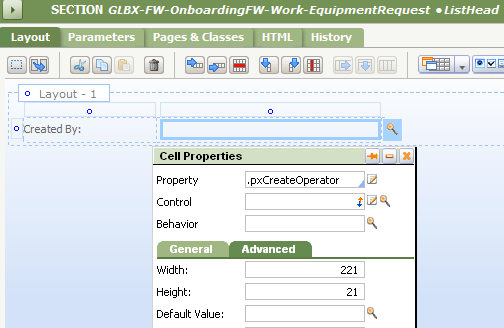
- Optionally, if you wish to change the look of the label to add focus and interest to your heading, edit the property's label field.
Select the Advanced tab of the label field, click the beside Inline Style, and change options as desired.
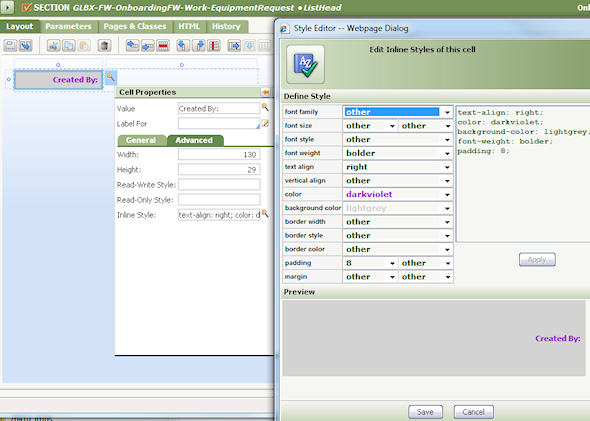
- Save the section rule.
Step 5: Configure the report definition rule to use the ListHead section you created in Step 4.
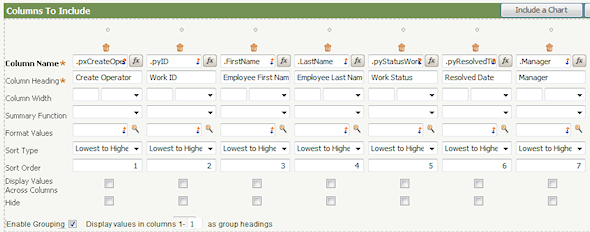
- In Columns to Include, make sure to include properties referenced in the section you created for the custom header. In this example, .pxCreateOperator is added as the first column name.
- Be sure to adjust Sort Type and Sort Order to meet your specific reporting requirements.
- Check the box for Enable Grouping. When you check this box, the field Use custom section for displaying group header appears in the General Report Settings section. In this example, only the first column is used for group headings. See Developer Help for more information about this field.
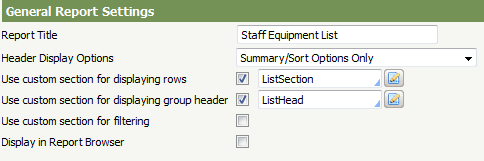
- In the General Report Settings section, check the box for Use custom section for displaying group header.
- Use the SmartPrompt to select the ListHead section you created in the previous step.
- You may choose to give the report a new title in the Report Title field.
- Click Save & Preview to view the report.
Additional Information
![]() How to expose a property as a database column with the Property Optimization tool
How to expose a property as a database column with the Property Optimization tool