How to include variable images in a report column
Summary
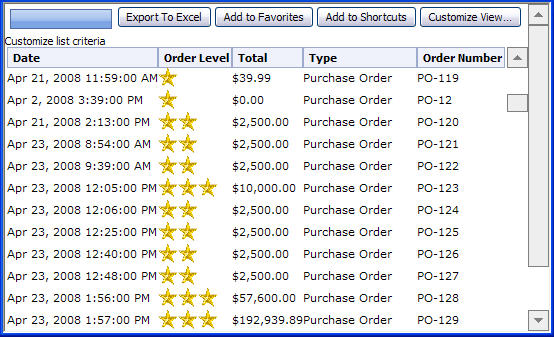
HTML properties define display characteristics for columns in a report. This article shows you how to use an HTML property to add a set of variable images to a column. For example, you could use the same image with varying colors to indicate when values in a column exceed specified levels.
Note: You can select from a list of images in binary file rules by choosing Tools > Image Catalog or you can upload and save your own images as Rule-File-Binary instances.
Suggested Approach
Use this procedure:
- To add your own images your application, create a rule for each image. Open the Technical Category and right-click Binary File, then choose New.
- In the App Name field, enter the directory in which the image is stored.
- Enter the File Name and extension.

- Click Create.
- Click Upload File.

- Browse for the file, then click Upload File.

- Click OK.
- Create an HTML property rule.
- In the Stream Name field, enter a name for the property.

- Click Create.
- In the HTML tab HTML Source section, enter your HTML code. In the example, the star image has been set to display up to three times when the property value reaches specified levels using a Java scriptlet.

- Click the Save icon.
- Create or edit a list view rule or summary view rule.
- For a list view, open the Display Fields tab. For a summary view, open the DrillDown tab and choose Detailed View.
- Locate the property that you would like to display as an image.
- In the HTML Property field of the property row, choose the name of the new HTML property file from the SmartPrompt list.
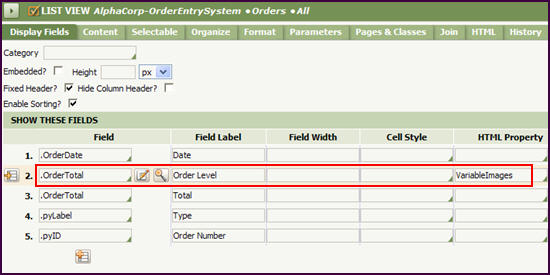
- Click the Save toolbar button..
- Click the Run icon. The view displays with the column of images. In the example, the column is Order Level.