How to use SMA to identify amount of data on requestor clipboards
Summary
The System Management Application (SMA) provides a feature named Requestor Management. Using it, you can view estimates of requestor data sizes for all unlocked requestors on a node This is information can help you identify requestor-related issues causing excessive memory demands on the node and significantly degrading performance.
You can also access this information in the AES Enterprise Health console. For more information , see How to use the Autonomic Event Services (AES), Enterprise Health console .
Unusually large amounts of requestor data are often related to activities that leave unnecessary pages on a requestor's clipboard. It is suggested that you review activities in your application and use the Page-Remove method to reduce the number of pages.
This article describes what information the Requestor Management feature provides and how to use it.
Suggested Approach
To start the feature, do the following:
- Select Tools > System Management Application to open SMA.
- Click Requestor Management in the left panel:
This opens the Requestor Management work area.
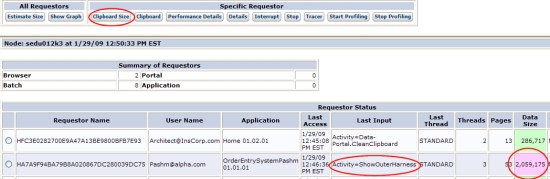
- To display the data size of all unlocked requestors on a node, click Estimate Size to display the values (KB) in the Data Size column:
The data size is within + or - 10% of the actual size. If the data size is within the node threshold, the box is green. In this example, a requestor's clipboard holds 2MB of data, which exceeds the 1MB threshold (not user-configurable). The value appears in a light purple box. The last input was an activity named ShowOuterHarness.
Note: To display a graph and report of performance statistics for requestors by type, click Show Graph . Click Back to return to the main Requestor Management screen.
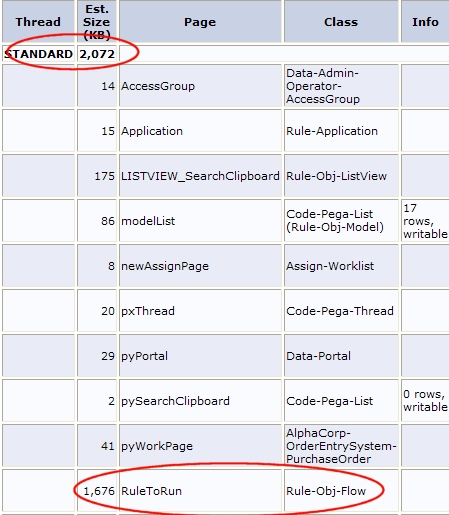
- To display the data size and clipboard for the requestor showing excess data, click the radio button on the row and click Clipboard Size . The report indicates the total data size (within the range of tolerance) for standard and requestor threads:
In this example, the standard thread is size is 2MB, the largest component being RuleToRun at 1.7MB.

Additional diagnostic tools
Use the other tools in the Requestor Management function to retrieve additional data about the requestor, which can be useful in diagnosing data size issues. Select a requestor from the list and do the following:
- Click Clipboard to open it and review the page properties (RuleToRun) related to this requestor transaction.
Click Back to return to the main Requestor Management screen.

- Click Performance to display the PAL performance statistics for this requestor.
Click Back to return to the main Requestor Management screen.

- Click the Details button to display a Trace Entry screen at the bottom of the window, showing trace lines for the operations that have been performed by the requestor. This is a snapshot of the information, and does not update in real time.

Investigate PEGA0004 (DB Bytes Read) alerts — This alert flags requestors with large amounts of clipboard data. To locate the activity that placed the data on the clipboard, check the alerts log or investigate BYTEREAD action items in AES.
- For more information about this alert, see Understanding the PEGA0004 alert - Quantity of data received by database query exceeds limit.
- For information about managing AES action items, see How to manage work in Autonomic Event Services (AES) Enterprise Edition.
Requestor management controls
For a selected requestor, use the following controls as described here:
- Interrupt attempts to stop the processing of the chosen requestor at the beginning of the next activity step. ( If the requestor is having an issue, such as executing a Java block which is in a loop, this may not be able to be interrupted.)
- Stop deletes the requestor. It is removed from the Requestor Status display and deleted from the system.
- Tracer starts the Tracer tool for the requestor. Use the Tracer to test and debug activities, decision rules, service rules, parse rules, and flows. You can see in summary or detail the processing that occurs as you or another requestor executes an activity, declarative rule, or flow rule.This screen updates in real-time as more operations are performed by the requestor.
-
Start Profiling and Stop Profiling toggle the Profiler tracing tool. In addition to the Activities Called information available from Tracer, the Profiler shows all of the When rules called, both in-lined and rule-resolved.
Previous topic How to set up Sun JVM v1.4.2 and v1.5 Next topic JVM configuration best practices