Performance guidance for production systems – System Settings
This content applies only to On-premises and Client-managed cloud environments
You can use the following settings and procedures to improve the performance of your Pega 7 Platform system:
- Settings in the prconfig.xml file
- Rule-Admin-System-Setting rules
- Production-level settings
- Log review
- Archiving and purging work items and related data
- Tuning SLA agents
- Cache monitoring
- BLOB tuning
- History filter and table partitioning
- HTML stream size alert
- Monitor external database connection times
- Index tables
- Monitor requestors
- Limit use of administrative tools in production
- Limit field-level auditing in production
- Install all relevant hotfixes
Settings in the prconfig.xml file
It is a best practice to have an entry in the prconfig.xml file that reflects each performance-related setting, so that current levels are readily apparent.
Because the Pega 7 Platform uses default values even when they are not included in the prconfig.xml file, creating specific entries with the default values does not change system behavior. However, adding them does give visibility to current entries and simplifies changing those values, if necessary.
The following settings are shown with their default values:
<env name="alerts/longrunningrequests/enabled" value="true" />
<env name="alerts/longrunningrequests/requesttime" value="600" />
<env name="alerts/longrunningrequests/notifications" value="3" />
<env name="alerts/PRThread/count/enabled" value="true" />
<env name="alerts/PRThread/count/threshold" value="5" /> Note: For thread-intensive applications such as the CPM Frameworks, this might need to be set at 12 or more.
<env name="alerts/services/totalRequestTime/enabled" value="true" />
<env name="alerts/services/totalRequestTime/threshold" value="1000" />
<env name="alerts/connectors/totalRequestTime/enabled" value="true" />
<env name="alerts/connectors/totalRequestTime/threshold" value="1000" />
Set the default value of SendStringParametersAsUnicode to true or false to indicate whether your application uses Unicode.
Note: If you are using PRPC 6.2 or later, you can save these settings in Dynamic System Settings instead of in the prconfig.xml file. See How to compose the key of a prconfig dynamic system setting and How to set prconfig values in a Dynamic System Setting value.
Requestor passivation
Requestor passivation is a best practice; it is a built-in feature that writes the memory footprint of idle user sessions to the file system. This frees up valuable memory for more active users. When inactive users resume their session, the memory is automatically and transparently refreshed from the database with minimal delay.
In a production setting, the default time-out setting of 60 minutes is usually too long. The following example shows a time-out setting of 10 minutes:
<env name="Initialization/PersistRequestor" value="OnTimeout" />
<env name="Initialization/noAuthenticateOnActivate" value="true" />
<env name="timeout/application" value="600" />
<env name="timeout/browser" value="600" />
<env name="timeout/portal" value="600" />
<env name="timeout/other" value="300" />
Rule cache tuning
The default setting for cache/instancecountlimit is 3000:
<env name="cache/instancecountlimit" value="3000" />
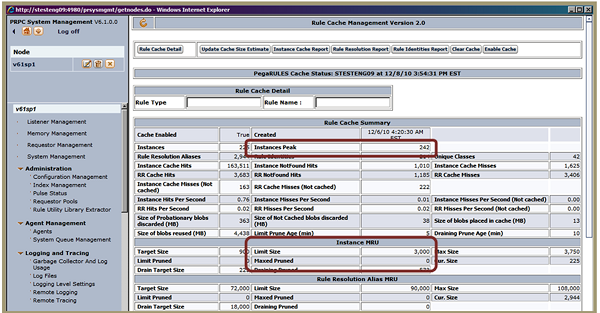
Increase this default if the Instance MRU reading for Max Pruned is not at or near zero, or if Instances Peak nears the Instance MRU Limit Size.
These cache readings are displayed on the SMA (System Management Application) Advanced > Rule Cache Management screen. In the following example, the Instances Peak of 242 is well below the Instance MRU Limit Size of 3,000, and the Instance MRU Max Pruned is zero.
First use assembly cache tuning
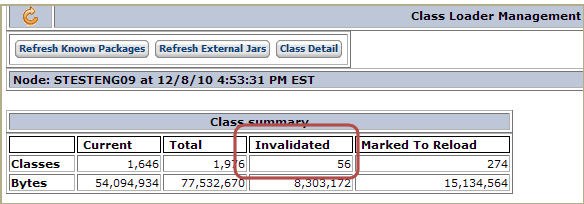
- Invalidated classes should be at or near zero. Increase the fua/global/instanceCountLimit from the default of 20,000 by increments of 5000 to reduce the invalidated classes. The default setting is:
- <env name="fua/global/instanceCountLimit" value="20000" />
To examine the number of invalidated classes, see SMA (System Management Application) > Advanced > Class Loader Management:
- Reduce the number of operators who have Rule Checkout enabled.
HTTP interaction time threshold
The default threshold for HTTP interactions is one second. If a particular screen takes more time to render, the system writes alert PEGA0001 to the alert log. This duration is often too aggressive and might need to be increased to 1.5 or 2.0 seconds.
The setting for excludeAssembly is included here so that initial Rule Assembly does not trigger alerts.
<env name="alerts/browser/interactionTimeThreshold/enabled" value="true" />
<env name="alerts/browser/interactionTimeThreshold/excludeAssembly" value="true" />
<env name="alerts/browser/interactionTimeThreshold/warnMS" value="1000" />
Database alerts
To identify database queries that return large amounts of data, and thus are candidates for tuning, set the Byte Threshold. This feature is off by default.
The warning threshold warnMB writes a stack trace to the alert log. The error threshold errorMB writes a stack trace and additionally halts the requestor. Thus, setting the warnMB entry to 10 will provide insight into which queries are requesting 10 MB or more of data. However, setting the errorMB entry to 50 halts the requestor only if a database query returns over 50 MB of data.
Based on the alert log results, adjust these settings periodically according to application requirements.
<env name="alerts/database/interactionByteThreshold/enabled" value="true" />
<env name="alerts/database/interactionByteThreshold/warnMB" value="15" />
<env name="alerts/database/interactionByteThreshold/errorMB" value="500" />
Log file data retention
Set log file data retention to a number of days according to your company’s policy. The following example retains log data for 30 days:
<env name="usage/retentionperiod" value="30" />
Note that the prlogging.xml file (Pega 7.2 or earlier) or the prlog4j2.xml file (Pega 7.3 or later) defaults to writing a new log with a unique name each time it starts. You can modify prlogging.xml or prlog4j2.xml to create a rolling daily log instead. See "Rolling log files daily" in How to customize logs with the prlogging.xml file (prlogging.xml) or the Apache Log4j2 documentation (prlog4j2.xml)
Rule-Admin-System-Setting rules
Rule-Admin-System-Setting rules store constants for system reference. You can tune work item system processing by adjusting the relevant rule, as described in Understanding service levels and System Settings for the Pega-ProCom Agent.
Production-level settings
Set the system's production level according to whether it is a test or production environment. Use a production level of 2 for development systems and 5 for production systems.
Log review
Review the Pega 7 Platform system logs daily and correct issues promptly, addressing the most frequently occurring errors first. The goal is to have clean logs in production systems.
- The Pega log contains system errors and exceptions, and their associated stack traces, and debug statements; and other messages not specified as alerts. The Pega log can contain messages created by your activities as well as messages created by standard rules.
- The Alert log contains specific alerts that identify individual system events that exceed performance thresholds, or failures.
- The Alert Security log contains alerts (named "SECUnnnn") specific to security issues.
See Performance alerts, security alerts, and AES for explanations of the alerts written to the various logs.
Note that scripts used in testing, and in load testing particularly, can trigger security alerts if they are not carefully written.
You can add a pointer to the System Management Application so that it includes garbage collection log analysis. Add the following entry to the prconfig.xml file:
<env name="GarbageCollection/Logfile" value=">>>path to gc log file<<<"/>.
Limit each garbage collection log to one JVM.
Logging levels
- During development, set the logging level to at least Error.
- Analyze the results at least daily, and address any issues promptly.
- Once in production, set logging levels to Error to examine the details of a particular issue; reset the level to Error when your research is complete.
For more information about setting logging levels, see About the Logging Level Settings tool.
For more information about analyzing log results, see:
PEGA0028 alerts indicate a failed garbage collection attempt. PRKB-26359 Performance guidance for production applications - JVMs, contains recommendations for responding to this alert.
Archiving and purging work items and related data
As the number of work items in the database grows, older or inactive work items and their related data need to be archived or purged. For guidance, see Use the Pega-RULES agent to purge selected database tables regularly.
Tuning SLA agents
SLAs for work items use agents for processing. In versions prior to PRPC 5.5, SLA agent activity might require tuning as the number of work items grows in a production system. See Understanding service levels and System Settings for the Pega-ProCom Agent.
Cache monitoring
To allow the rule resolution process to perform efficiently in enterprise-scale systems, the Pega 7 Platform uses caches to temporarily store data and reduce retrieval time. System administrators can tune each of these caches (by using settings in the pegarules.xml file) to set each cache to the most efficient size for their particular application. For guidance, see Determining the rule cache rule count and size.
BLOB tuning
Review the size of your binary large object (BLOB) column with your database administrator. For more information, see Database LOB Sizing and Performance Optimization.
Database tables that are the target for Rule-Declare-Index rules are candidates for optimization by removing the pzPvStream (BLOB) column. For example, if workparties are used in work items and no customization is required, removing the pzPvStream column from thepc_index_workparty table can improve system performance. pzPvStream column are:
- Targets for Rule-Declare-Index rules.
- Tables that are unlikely to change.
- Tables whose data is expected to grow or change over time
-->
History filter and table partitioning
In your production system, choose which work item updates are written to history to control the size and growth rate of the history tables. For details about what items are available and how to choose what is recorded, see How to control history instances written to the audit trail.
Periodically review the history tables in the database. Tables containing history and work item data can grow sufficiently large so that partitioning the database tables is justified.
HTML stream size alert
The PEGA0029 alert in the Alert Log indicates that an HTML stream sent to the browser exceeds the threshold. The default threshold is 204,800 bytes. If necessary, adjust the threshold. The default prconfig.xml setting is:
<env name="alerts/clientbytesreturned/threshold" value="204800" />
Monitor external database connection times
The PEGA0020 alert in the Alert Log indicates that a message was received from an external database and that the interaction time was longer than a defined threshold. If necessary, adjust the threshold. The relevant prconfig.xml settings are:
<env name=" alerts/connectors/totalRequestTime/enabled" value="true" /> (Toggles the alert on ("true") or off ("false") ).
<env name=" alerts/connectors/totalRequestTime/threshold" value="1000" /> (The default threshold is 1000 milliseconds (1 second) ).
Index tables
Do not use an index table for more than one class or purpose. For details on setting up an index, see How to create declarative indexes for embedded properties.
Monitor requestors
Monitor and adjust the number of requestors in the batch requestor pool.
To monitor the requestor pool and wait times, see section 9.4, "Requestor Pools", in the System Management Application Reference Guide.
To alter the number of requestors in the pool, use the agent/threadpoolsize setting in the prconfig.xml file. For details, see the Configuration Settings Reference Guide.
Limit use of administrative tools in production
Limit or prevent use of administrative tools on your production systems. In particular, instances of the class Log-Usage are stored in the table pr_perf_stats, so limit its use in production.
Secure the servlets for the System Management Application and prdbutil to prevent unauthorized use, following the procedure described in Implementing authentication for PRSYSMGMT and PRDBUTIL.
Limit field-level auditing in production
Limit the use of field-level auditing in production systems to less volatile objects, such as access groups. Except as needed to support business reporting requirements, avoid the use of field-level auditing for properties in work items, because this increases the size of history tables.
Install all relevant hotfixes
Identify and install all related hotfixes for the Pega 7 Platform version in use before testing. Contact Global Customer Support for assistance in identifying and installing the correct hotfixes.
Additional Information
Performance guidance for production applications - Operating Systems
Performance guidance for production applications - Application Servers
Previous topic How to use the PegaRULES Log Analyzer Next topic Alert log message data